Structured logs are the latest component of the OpenTelemetry protocol (OTLP) to stabilize. The promise of structured logging with OTLP is huge: built around a common data model and tightly-specified protocol, fully-structured application logs should soon be able to be shipped from just about any application to any log server with a minimum of fuss.
As of today, there aren't a lot of OTLP log sources implemented, though they're coming along quickly in .NET and Java, with more ecosystems sure to follow suit.
There are even fewer self-hostable log servers that can accept OTLP ingestion; Seq 2023.2 is the very latest of these, and this post shows how to get logs from standard OTLP sources into Seq, and how you might interact with them once they get there.
Installing Seq
If you're not already running Seq, you can set it up locally under the free Individual License in just a few seconds:
To run Seq in a team environment, you'll need a subscription or trial.
Configuring the source
With Seq up and running at https://seq.example.com or wherever you are hosting it, the easiest way to start logs flowing is to use the HTTP/protobuf flavor of OTLP.
Along with selecting HTTP/protobuf as the protocol, you'll need to specify the HTTP or HTTPS endpoint address that will receive logs, and an (optional) API key header:
- Endpoint URI — The Seq OTLP/HTTP ingestion path is
/ingest/otlp/v1/logs. If your Seq server is athttps://seq.example.com, the endpoint address will behttps://seq.example.com/ingest/otlp/v1/logs. - API key header — If you're using Seq API keys to track the origins of log events, configure your log source to send an API key in the
X-Seq-ApiKeyheader, along with OTLP ingestion requests.
The examples below show the sources we're most familiar with, but the important configuration comes down to only the protocol, endpoint URI, and (optional) API key header, so these instructions should transfer very easily to your logging library of choice, whether that's in .NET, Java, Node.js, Go, Rust, or elsewhere.
.NET OpenTelemetry SDK
To send events from a .NET application using Microsoft.Extensions.Logging, you'll need to install the OpenTelemetry.Exporter.OpenTelemetryProtocol.Logs package, from the opentelemetry/opentelemetry-dotnet project:
dotnet add package OpenTelemetry.Exporter.OpenTelemetryProtocol.Logs --prerelease
Assuming that you're building an ASP.NET Core application (I started with dotnet new mvc), your startup code in Program.cs needs to call AddLogging() on your web application builder, and from there, AddOpenTelemetry() and AddOtlpExporter():
var builder = WebApplication.CreateBuilder(args);

// <snip>

builder.Services.AddLogging(logging => logging.AddOpenTelemetry(openTelemetryLoggerOptions =>
{
    openTelemetryLoggerOptions.SetResourceBuilder(
        ResourceBuilder.CreateEmpty()
            .AddService("GettingStarted")
            .AddAttributes(new Dictionary<string, object>
            {
                ["deployment.environment"] = "development"
            }));

    openTelemetryLoggerOptions.IncludeScopes = true;
    openTelemetryLoggerOptions.IncludeFormattedMessage = true;

    openTelemetryLoggerOptions.AddOtlpExporter(exporter =>
    {
        exporter.Protocol = OtlpExportProtocol.HttpProtobuf;
        exporter.Endpoint = new Uri("https://seq.example.com/ingest/otlp/v1/logs");
        exporter.Headers = "X-Seq-ApiKey=fd8sHZ28fajva8t32Ngjfdisp";
    });
}));

var app = builder.Build();
The protocol, endpoint, and API key header are all configured in the AddOtlpExporter() configuration callback.
The IncludeScopes option attaches log event properties originating from ILogger.BeginScope() calls and other enrichment points provided by ASP.NET Core. If you don't set this option, your events will be missing important information like the details of any currently executing HTTP request.
IncludeFormattedMessage changes the way that the log record is serialized, ensuring Seq can correctly determine which part of the event is the original log message template. Omitting this will cause the exporter to use the message template as the log record body, where Seq expects to find the human-readable description of the event, and this will lead to a less pleasant user experience in Seq.
The rest of the example shows how to set the service.name resource attribute, plus some additions you might like to add such as deployment.environment. These values end up attached to every log event collected by Seq, so it pays to be conservative in your selection of which attributes are valuable enough to collect.
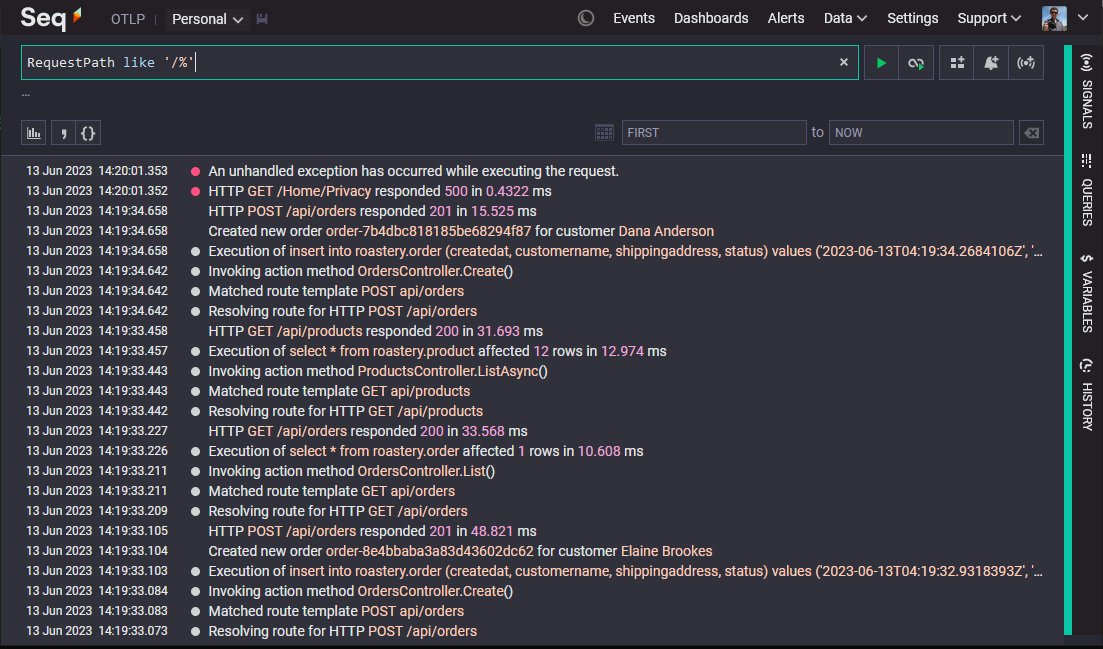
If you've done everything right, starting up your application should result in some events being collected:
If you can't see any events in Seq, check the protocol, endpoint, and API key headers - in particular, the endpoint URI's scheme (http or https), hostname, and port, need to be exactly what you'd type into a browser in order to view your Seq server's web UI.
OpenTelemetry Collector
The OpenTelemetry Collector is a log processor akin to Fluent Bit, Logstash, or Datadog's Vector: the collector receives incoming telemetry data on various protocols, performs processing if needed, and then exports data on various other protocols.
To export logs to Seq from the OpenTelemetry Collector, first add otlphttp to the exporters node in your collector config:
exporters:
  otlphttp:
    endpoint: https://seq.example.com/ingest/otlp
Note that the endpoint path should not include the /v1/logs suffix, as this is added automatically by the collector.
At the time of writing, it doesn't appear that the collector supports specifying HTTP headers for outgoing OTLP requests; if you figure out how to do this or see that it's been added, please let us know.
Next, add the exporter to the service.pipelines.logs node:
service:
  pipelines:
    logs:
      exporters: [otlphttp]
If logs don't start flowing, check the collector container's terminal output.
Working with OpenTelemetry Logs in Seq
First off - everything you might already know about structured logging with Seq still applies. Log event properties from OpenTelemetry are all first-class, and you can easily filter, correlate, and aggregate with any of them. The Seq documentation has all of the info you might need.
OpenTelemetry log sources add two more pieces of data to log events in Seq:
@TraceIdand@SpanIdbuilt-ins, and- the
@Resourcenamespace.
Filtering by trace or span
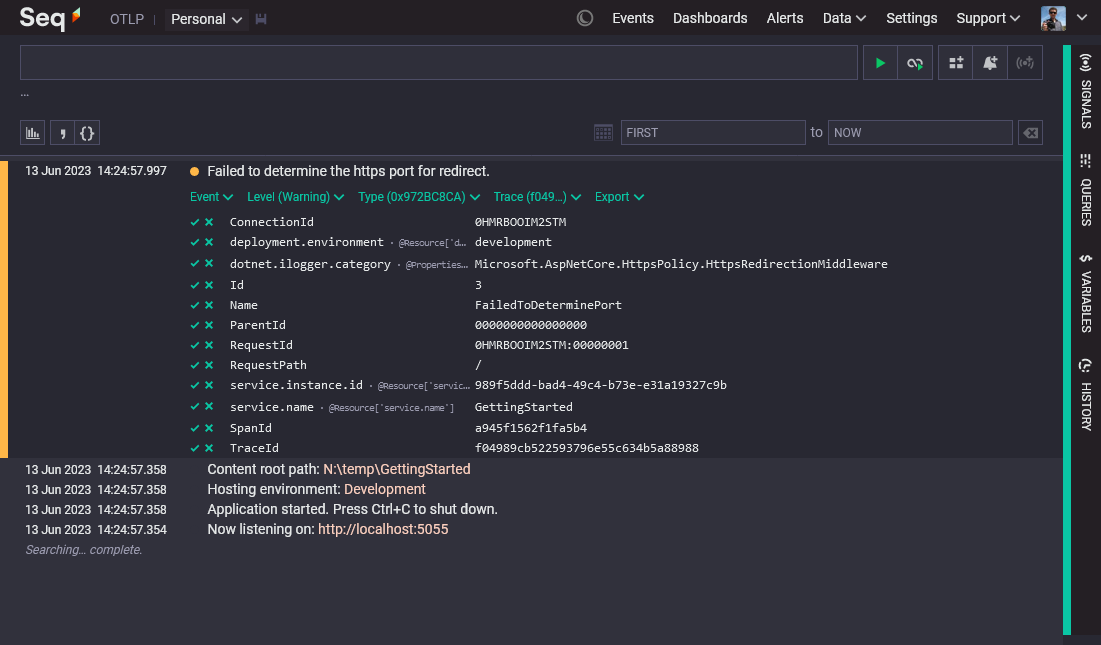
Logs arriving via OTLP that were emitted in the context of a trace will carry trace and span ids, mapped to Seq's @TraceId and @SpanId properties respectively.
You can spot these events by the presence of a Trace entry in the event actions menu:
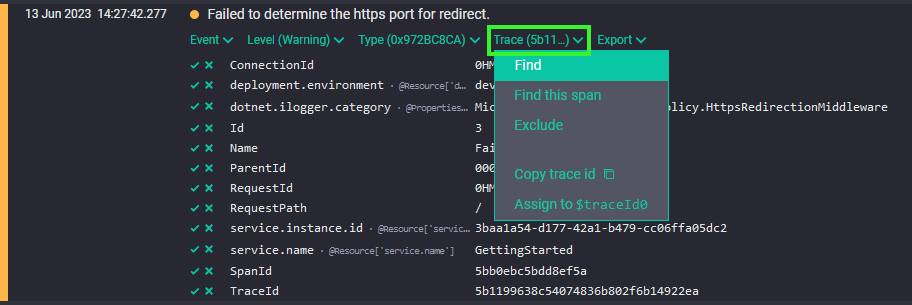
Trace ids group the log events raised during a logical operation, even if the operation crosses system boundaries. To find all of the events belonging to a trace, drop down the Trace menu and choose Find.
Accessing resource properties
OpenTelemetry defines separate namespaces for the direct properties of a log event, and properties describing the resource that originally emitted the event.
Seq's implementation is guided by a very strong preference for preserving all of the data sent to it, so instead of combining these in a potentially lossy operation, resource properties are stored separately under a built-in called @Resource.
If your OTLP log source describes itself with the service.name value GettingStarted, then you will find this in @Resource['service.name'] on the resulting events:
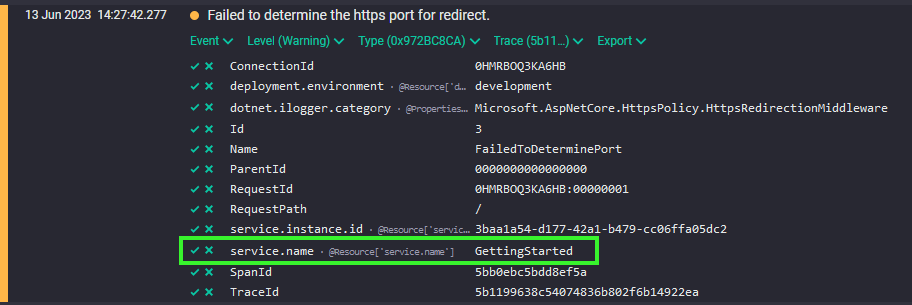
You can spot resource properties because of the inlay hint shown beside their names.
Learning more
There are a few places to learn more about OpenTelemetry and how you might use it with Seq:
- Ingestion with OpenTelemetry — Seq's OpenTelemetry ingestion documentation
- Ingestion from the .NET OpenTelemetry SDK — Seq's documentation for .NET SDK integration
- OpenTelemetry Logs — the OpenTelemetry Logs specification
- opentelemetry.io — the homepage of the OpenTelemetry project
- Serilog.Sinks.OpenTelemetry — a Serilog sink that sends events to an OTLP endpoint
Get in touch here or via Seq Discussions if you need help getting started or have ideas for making the overall experience better.